Standard Deviation


Mathematicians (bless their hearts!) have provided the physicist with
many useful tools. In the area of experimental uncertainty one of
their contributions is called "standard deviation". Standard
deviation is a statistical measure of the scattering of a set of
data. Specifically, if a set of data is normally (randomly, for our
purposes) distributed about its mean, then about 2/3 of the data
values will lie within 1 standard deviation of the mean value, and
about 95/100 of the data values will lie within 2 standard deviations
of the mean value.
|
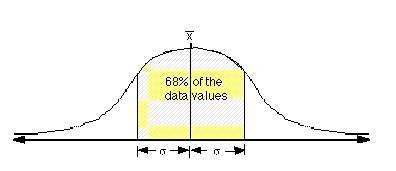
In a normal (Gaussian, random) distribution of data,
about two-thirds of the data values will fall within one
standard deviation ( ,
the Greek letter "sigma") of the mean value ( ,
the Greek letter "sigma") of the mean value ( ) )
|

|
|
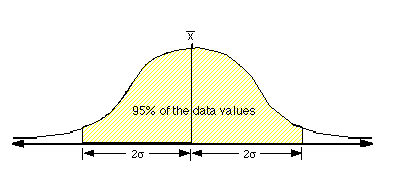
In a normal distribution, about 95% of the data values
will fall within two standard deviations of the mean
value.
|

|
We aren't going to go into the mechanics of calculating the
standard deviation of a distribution by hand - you can consult a
statistics text if you are interested. You need to know what the
standard distribution tells you about your data, and that Excel will
calculate it for you using "STDEV(range of cells)".
If your data values are widely dispersed ("all over the place"),
then the standard deviation of the data values will be relatively
large. This might indicate poor experimental technique (which is bad)
or malfunctioning equipment (which is also bad) - in other words,
this might be a "back to the drawing board" indicator. On the other
hand, if your data values are tightly grouped about a mean value the
standard deviation will be a relatively small number.
Standard Deviation of the Mean
Actually, what you really want to know is "What is a reasonable
uncertainty to assign to the mean value of my data?" - after
all, the mean value is the one that you will use as your best
estimate. You might suspect at this point that this "reasonable
uncertainty" would be either one or two standard deviations (as
above), but that isn't exactly true.
Mathematicians have shown that the uncertainty of the mean value
of a normal distribution is smaller - generally much smaller - than
the standard deviation of the entire distribution. (Why is this
reasonable?) They have proven that there is about a 2/3 probability
that the "true value" will lie within  (where
  is the standard deviation of the data, and n is the number of data
values) of the mean value, and about an 95% probability that the
"true value" will lie within twice this distance from the mean value.
This number (
 )
is called the "standard deviation of the mean", and whenever we say
"standard deviation" in reference to a mean value, we mean "standard
deviation of the mean". We will use the standard deviation of the
mean (SDOM) as a measure of the precision of our measurements.
An Example:
|
Trial
|
Group A
|
Group B
|
|
1
|
9.7
|
16.4
|
|
2
|
9.9
|
4.6
|
|
3
|
10.5
|
2.6
|
|
4
|
10.1
|
20.3
|
|
5
|
9.6
|
5.2
|
|
6
|
9.7
|
|
|
7
|
9.4
|
|
|
8
|
9.8
|
|
|
9
|
10.0
|
|
|
10
|
9.6
|
|
|
Mean Value ( ) )
|
9.8
|
9.8
|
|
Standard Deviation ( ) )
|
0.3
|
8.0
|
|
SDOM ( ) )
|
0.1
|
3.6
|
|
Graph
|

|

|
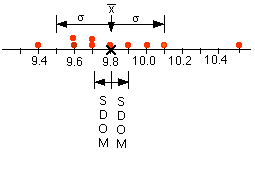
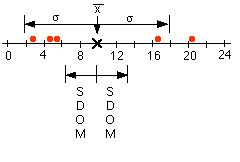
The table above shows some (contrived) data for two ficticious lab
groups, Group A and Group B . In this experiment, Group A has run 10
trials for a measurement, and calculated a mean value of 9.8 (in some
units). Group B has run 5 trials, and their mean value is also 9.8.
Same results, right? Well, no - but we'll discuss that later.
For now, notice that most (but not all) of the data falls within
one standard deviation of the mean value, and just about all of the
data falls within two standard deviations of the mean. In the example
above, only Group A's trial #9 - 10.5 is more than two standard
deviations from the mean. This means that it is an unusual value -
but unusual things happen all the time!
Group A has not only taken more data (which possibly indicates
more time and energy invested) than Group B, but their data values
are much more closely grouped, as indicated by the much smaller
standard deviation of their data (which possibly indicates more care
and skill in gathering the data). Notice, too, that their data
produces a much smaller standard deviation of the mean (SDOM), which
means that their experiment can provide a much better test


last update May 23, 2004 by JL
Stanbrough
![]() ,
the Greek letter "sigma") of the mean value (
,
the Greek letter "sigma") of the mean value (![]() )
)


