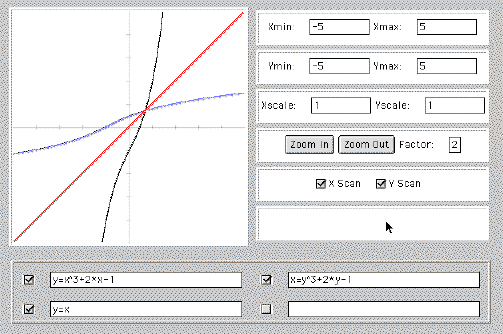
You can type values directly into the Xmin, Xmax, Ymin, and Ymax boxes to the right of the graph. You have to press the <Enter> or <Return> key on your keyboard after typing the value. Be sure that Xmin < Xmax, and Ymin < Ymax.
The values in Xscale and Yscale determine the spacing of the tick marks on the x- and y-axes respectively. Be sure to press <Enter> or <Return> on your keyboard after typing a value.
To zoom in or out:
The zoom will use the current value of the zoom factor. In other words, if you zoom out using a zoom factor of 2, you will double the range of values that you see in both the x and y directions, allowing you to see 4 times the area in the graphing window. Zooming in works in a similar way.
To set the zoom factor, type a value in the zoom factor box, then press <Enter> or <Return> on your keyboard. The new value will be used for the next zoom operation.
If you click your mouse at any point of the graph, the graph will be redrawn with this point in the center of the viewing window.