Here is an Excel spreadsheet that performs the calculations outlined on the previous page and graphs the results. Actually, this spreadsheet will calculate acceleration, velocity, and position for an object falling in a fluid with a drag force equal to bvn, where n is any value.
The value of "n" (in cell B13) determines the exponent of the velocity, so n = 2 means that the drag force is bv2. The value of "dt" in cell B14 controls the calculation time interval. The value of "Vterm" in cell B15 is the object's terminal velocity. If you want to change the value of g, use cell B12. The value of the drag coefficient "b" is calculated from the equation |
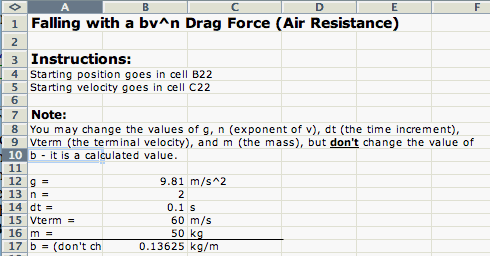 |
You can change the starting position in cell B22, and the starting velocity in cell C22. |
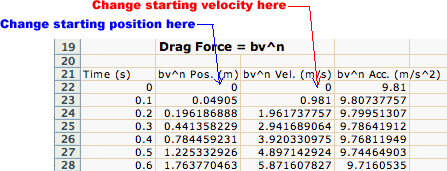 |
Note that after 10 s have elapsed, the object falling against the drag force would have fallen about 360 m, have a speed of about 56 m/s, and an acceleration of about 1.3 m/s2. If the same object were in free fall (no air resistance) it would have fallen about 490 m, have a velocity of about 98 m/s, and an acceleration of about 9.81 m/s2. |
 |
| The spreadsheet also plots graphs of position, velocity, and acceleration of the object versus time. The graph shown at right is a position versus time graph for the above motion. | 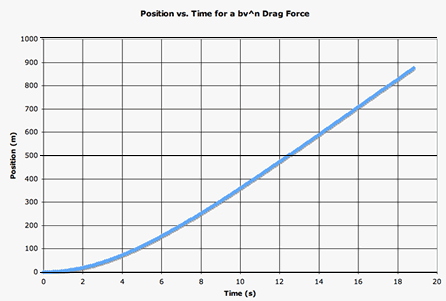 |
| The graph shown at right compares the drag-force velocity (blue) and the free-fall velocity (red) of the object. | 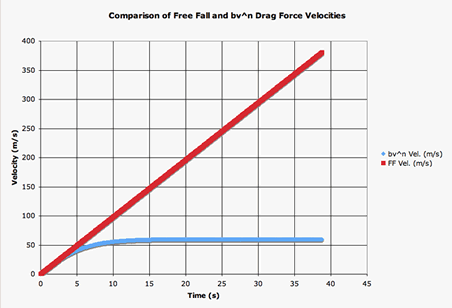 |
| The graph shown at right compares the drag-force acceleration (blue) and the free-fall acceleration (red) of the object. | 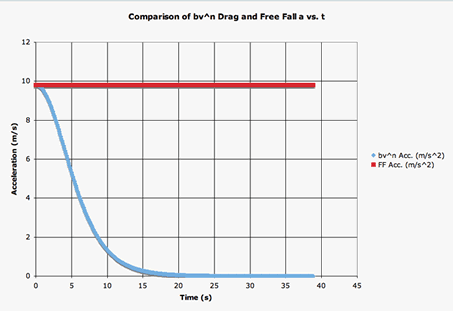 |
last update January 25, 2008 by JL Stanbrough