 You
know that an object in free fall will fall a distance x in time
t:
You
know that an object in free fall will fall a distance x in time
t:BHS -> Staff -> Mr. Stanbrough -> AP Physics-> Kinematics-> this page
Calculate "g" from measurements taken from a falling body.
|
Vernier ULI Interface |
photogate |
|
ring stand |
ring stand clamp |
|
"picket fence" apparatus |
something soft to catch the fence |
 You
know that an object in free fall will fall a distance x in time
t:
(Equation 1)
where vo is the object's initial velocity and g is the object's acceleration. Theoretically then, you could determine "g" by measuring the distance that an object falls in a given time. In practice, however, measuring the distance that an object falls in a given time can be tricky, since the times involved in falling reasonable laboratory distances are extremely short. This lab provides the necessary precision by using a photogate to trigger a very precise timer.
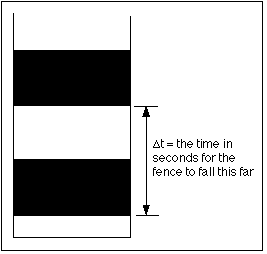
A photogate consists of an infrared LED (Light Emitting Diode) to produce a beam and a photocell to detect the beam. When the beam is broken, the photogate triggers a computer-controlled timer. When the "picket fence" is dropped through the photogate, the timer records the times for each "picket" to pass through.
If the "Picket Fence" experiment file is not loaded on the computer, do so. This experiment file controls the Vernier ULI Timer software. It is configured so that all you need to do is press "Start", drop the picket fence, press "Stop", and collect your data.
The experiment file assumes that the distance between "pickets" is 5.0 cm. If this is not the case, change the "Length" parameter in the Setup Window of the ULI Timer (or ask the instructor for assistance).
The picket fence will break, and it will scratch. That would be bad.
|
Photogate open |
|
|
Photogate blocked |
|
Before you make your first run, be sure that the photogate triggers correctly. When you block the beam with your hand you should notice a change in the icon labeled 1 in the upper-left corner of the ULI Timer control window.
After you press "Start", the timer will not begin until the first "picket" breaks the photogate beam, so you can drop the picket fence whenever you get ready.
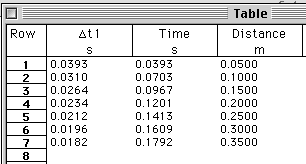
The "Table" window in the ULI Timer program contains the data. The first column (Dt) contains the "raw" times for the passage of each picket through the photogate. The second column contains the elapsed time so far (you should check this) and the third column contains the total distance fallen.
|
|
 |
To analyze the data conveniently, copy the data for each run from the table in the ULI Timer to the Clipboard, then paste it into a new data set in the Graphical Analysis program. Equation 1 (above) says that the graph of distance vs. time should be a parabola. An "automatic curve fit" using a polynomial of degree 2 should then do the trick. (The Graphical Analysis program should hold the data for all of your trials at once - each in a separate data set. The ULI Timer program will only hold one set of data at a time.)
You can calculate a value of "g" from the coefficient of t2 that the Graphical Analysis program gives you. You can then either build a manual data table to collect the value of "g" for each trial, or use a ClarisWorks spreadsheet.
|
A Sample Spreadsheet |
|---|
|
|
|
|
It would be nice to know the mean value of "g" and its experimental uncertainty, wouldn't it? It would also be nice to know how your value of "g" compares to an "accepted value". (For the measurement challenged, the last sentence means "calculate a percent of difference" - don't just say "Golly! That's close!")