 The
kinematics of constant acceleration tells us that:
BHS -> Staff -> Mr. Stanbrough -> AP Physics-> Kinematics-> this page
To measure the acceleration of free fall, "g".
 The
kinematics of constant acceleration tells us that:
so, as long as air resistance is not a factor, if you drop an object from rest from a relatively height, h:
where t is the time that it takes to fall the distance h. Solving for g gives:
Therefore, it is theoretically straightforward to determine the acceleration of free fall simply by dropping something and measuring the time it takes to hit the ground.
Experimentally, however, it is exceedingly difficult to get precise-enough times for meaningful results. (It often turns out that the theoretically straightforward approach is exceedingly impractical in the "real world"...) Over short distances (and short times), human reaction time destroys the precision of the measurement, and over long distances, air resistance becomes a factor so that the acceleration of the object is no longer constant and the calculation is invalid. These considerations (among others) are what forced Galileo to develop his famous inclined plane experiment.
The Pasco Free-Fall Adapter gives us the technology to obtain precision timing for objects dropped relatively short distances, however. When the ball is dropped, it activates a switch to start a very accurate timer. When the ball strikes the pad at the end of its fall, it trips another switch to stop the timer. Simple and straightforward!
|
Pasco Science WorkshopTM interface |
free-fall Adapter |
|
meter stick/metric tape |
metal sphere |
|
ring stand |
ring stand clamp |
|
C-clamp |
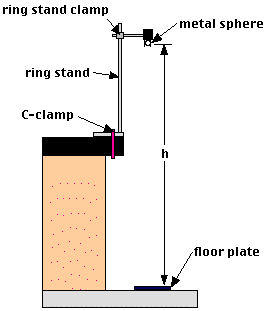
Set up the apparatus as shown in the diagram above. The C-clamp just needs to be tight enough to keep the apparatus from being knocked off the lab table - demonstrate you monstrous strength elsewhere, please.
Hint:Turn on "Show Balloons" in the Help Menu. It will explain the purpose of the various icons in the Pasco interface - which is a big help.
|
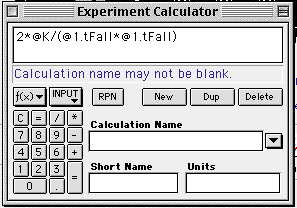
Here is what the Calculator Window might look like for a calculation of acceleration. You should understand how this formula relates to the equation shown above. |
 |
I'm not sure what the Pasco people have in mind for this lab, but the following procedure seems to work pretty well. Of course, if you have a better idea, try it! Basically, each "run" consists of several trials at the same height. I've found that adjusting the height during a run leads to problems (like the ball missing the floor switch...). This also allows you to get a good idea of the timing precision. A Science WorkshopTM graph window will only display three data runs at once, but you can transfer the averaged data to Graphical AnalysisTM for analysis. Here's how:
 Click
the Record icon (
Click
the Record icon (![]() Have
the Science WorkshopTM program calculate
statistics (
Have
the Science WorkshopTM program calculate
statistics (![]() )
for the time of fall for each run. Open the Graphical
AnalysisTM program, and transfer the mean time of fall
and the height for each run to the Graphical AnslysisTM
data table. Add
a column to the data table and place the formula
for t2 ("=t^2" or "=t*t") in it.
)
for the time of fall for each run. Open the Graphical
AnalysisTM program, and transfer the mean time of fall
and the height for each run to the Graphical AnslysisTM
data table. Add
a column to the data table and place the formula
for t2 ("=t^2" or "=t*t") in it.
Construct a graph of t2 vs. height. Add error bars to the graph. (You can get a pretty good idea of the uncertainty of the time of fall from examining the original data and the data statistics in the Science WorkshopTM data table.) Draw the best fit regression line, and get regression statistics for the line. You can calculate "g" fronm the slope of this line, right? Also, be sure to determine the uncertainty in your value of "g". What is the percent of difference between your calculated value and an "accepted value" of "g" (consult the Handbook of Physics & Chemistry)?
So, what do you think? In particular,