BHS -> Staff -> Mr. Stanbrough -> AP Physics-> AP Labs-> this page
I'm sure you've noticed that if you attach an object to the end of a hanging spring and release it, the object vibraates up and down. We will study this motion, called simple harmonic motion (SHM), later in some detail. For now, though, just notice that the period of the vibration (the time to repeat the motion once) depends on the mass of the attached object. A physicist would ask "How does the period of this motion depend on the mass?"
So, the purpose of this experiment is to answer the question, "How is the period of the simple harmonic motion (SHM) of an object attached to a spring related to the object's mass?"
The theoretical prediction for the relationship between period and mass in SHM (we will study this later) is that the period is proportional to the square root of the mass, so we could ask "Is the period of motion of a spring in SHM proportional to the square root of the mass of the attached object?"
The mathematical relationship between period and mass may not be quite as obvious as the relationship between force and stretch in the first experiment. However, you proceed in much the same way. You collect data - measuring the period of vibration over as wide a range of masses as possible - with an eye toward drawing mass vs. period graphs for particular springs. As you do so, you need to keep in mind the burning question "What is the precision of this measurement?".
There is an important experimental technique that you can use to
increase the precision of the period measurement. Suppose that you
can time an interval (using a stopwatch) to a precision of ![]() . Then, suppose that you time one period of vibration of a mass and
get a value of 2.0 s. This is
. Then, suppose that you time one period of vibration of a mass and
get a value of 2.0 s. This is ![]() ,
which has a measurement uncertainty of 25% - not very impressive.
,
which has a measurement uncertainty of 25% - not very impressive.
Suppose, however, that we timed 20 periods of the motion, which
took 40.0 s. The period is (40.0 s)/20 = 2.00 s (note the significant
digits) and the uncertainty is (0.4 s)/20 = 0.02 s, so this
measurement of period is ![]() which is a 1% measurement!
which is a 1% measurement!
|
assorted small springs |
ring stand |
set of known masses |
|
ring-stand clamp |
c-clamp |
stop watch |
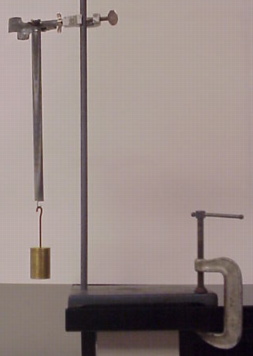 Setup:
Go back and re-read your statement of purpose for this lab. Now, answer the question. Here are some additional points you might want to cover:
BHS -> Staff -> Mr. Stanbrough -> AP Physics-> AP Labs-> this page