BHS -> Staff -> Mr. Stanbrough ->GA How-To Notes -> this page
|
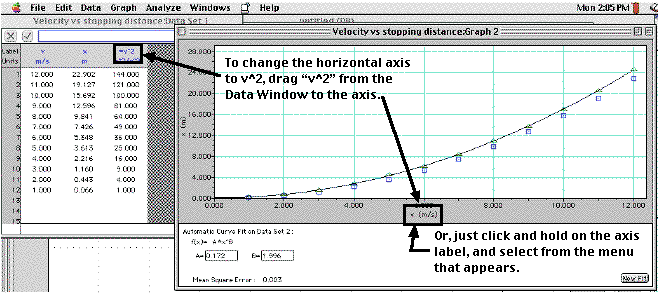
For example, to change the quantity graphed on the horizontal axis from "v" to "v^2" in the example below, either drag the "v^2" from the Data Window to the horizontal axis, or click and hold the "v" in the Graph Window and select from the pop-up menu. |
 |