Graphical AnalysisTM
Opening the Program
![[Up]](../APPhyNet/NavIcons/Up.GIF)
![[Home]](../APPhyNet/NavIcons/Home.GIF)
![[Help]](../APPhyNet/NavIcons/Help.GIF)
BHS
-> Staff
-> Mr. Stanbrough ->GA
How-To Notes -> this page
When you open the Graphical AnalysisTM software, you get the
following:
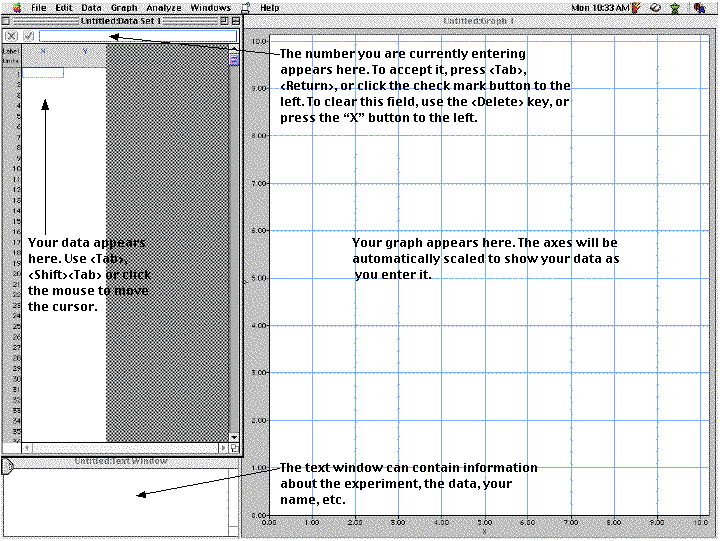
The three windows function as follows:
- Data Window: Type your data (or paste it from the Clipboard)
into the data window. Use <tab> or the mouse to move to
different values. To change the column headings ("Labels" and
"Units"), click the mouse in the appropriate space and type the
names of your quantities in place of the "X" and "Y". Units go on
the second line of the title. Additional data columns, as well as
calculation columns, can be added to the Data Window.
- Graph Window: The data entered into the Data Window will be
displayed automatically in the Graph Window. It is easy to specify
graph options, as well as change what quantities the graph
displays.
- Text Window: Gives you a place to keep notes about the
experiment.
last update July 3, 2000 by JL
Stanbrough