Pasco Science WorkshopTM

Adding a Graph


[Up][Home][Help]

BHS -> Staff -> Mr. Stanbrough ->Pasco Interface Notes-> this page


To add a graph to an experiment:

  1. The diagram at right shows how to add a graph to display the data collected by a probe. (A photogate is shown.)

    Dragging the graph icon.

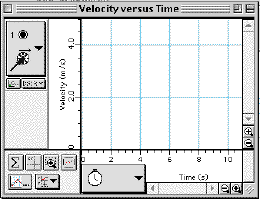
    The screen shot at right shows a graph which displays velocity in m/s (collected by a smart pulley) vs. time (s).

    New graph
    drag the graph icon (graph icon) to the probe icon(photogate icon) located just below the picture of the interface..


See also:


[Up][Home][Help]

BHS -> Staff -> Mr. Stanbrough ->Pasco Interface Notes-> this page
last update June 31, 2000 by JL Stanbrough