AP Physics - Experiment 1
Stretch and Force for a Spring
(low-tech version)

![[Up]](../../../NavIcons/Up.GIF)
![[Home]](../../../NavIcons/Home.GIF)
![[Help]](../../../NavIcons/Help.GIF) [Lab
Index]
[Lab
Index]
BHS
-> Staff
-> Mr. Stanbrough
-> AP
Physics-> AP Labs-> this
page
Purpose:
Everybody knows that when you apply a force to a spring or a
rubber band, it stretches. A physicist would ask, "How is the
force that you apply related to the amount of stretch?".
Every physics experiment has a purpose, often phrased as a
question that the experiment hopes to answer. Generally, we want to
know "What is the (mathematical) relationship between quantity A and
quantity B?", as in "How is the force applied to a spring related to
the amount the spring stretches?".
Often, we have a theoretical prediction about a relationship that
we want to check, as in "Is the acceleration of an object directly
proportional to the net force on it?". In this case, there is a
theoretical prediction (that we will make use of later) called
Hooke's Law, that says that the stretch of a spring is proportional
to the applied force (in symbols, F = kx, where k is a constant). So,
we could state the purpose of this experiment as "Is the
stretch of a spring proportional to the applied force?"
It is extremely important that you know and understand the
purpose of an experiment before you begin. For one thing, the
experiment must be designed and carried out so that only the two
relevant quantities are allowed to change. If this is not carefully
attended to (and there are generally many quantities that
could affect the results of an experiment) the experimental results
will be worthless.
Of course, there are some secondary (but still very
important) purposes for this lab. (We aren't really spending a whole
lab period "discovering" something that has already been known for
hundreds of years...) They are:
- learning to think about, and use, precision in measurement,
and
- learning how to draw, manipulate, and interpret graphs.
Discussion:
What sort of result - what sort of answer - would a
physicist expect in an experiment? The very best result would be an
equation that expresses the mathematical relationship
between the two quantities involved in the experiment. In this case,
the very best result would be an equation that
expresses the mathematical relationship between force and stretch for
a typical spring. So, how do you "come up" with such an answer?
Well, thinking backwards, if you had a set of graphs that
showed the relationship between force and stretch for some springs,
perhaps we could say "Gee, all of these graphs have pretty-much the
same character, and my experience with graphs of functions tells me
that an equation that produces graphs like these is _____." You might
suspect that filling in this blank can be pretty difficult, but in
fact, usually it isn't. As you proceed in your study of physics you
will learn some techniques that generally turn a graph into an
equation with a minimum of fuss. So, if you have a set of graphs that
show the relationship between force and stretch for typical springs,
you are pretty-much "golden". How do you get these graphs?
You need data. You need to know how much force produces how
much stretch - for as wide a range of force and stretch as
possible.
Clearly, you need to measure both the stretching force and the
amount of stretch - how much known forces stretch a spring. A
convenient way to apply a precisely-known force is to let the weight
of a known mass be the force used to stretch the spring. The force
can be calculated from W = mg. The stretch of the spring can be
measured by noting the position of the end of the spring before and
during the application of the force.
There are a lot of things to think about when collecting data:
- Data collection should be organized. A
well-thought-out data table is the only way to go here. You should
have the data table ready to go when you enter the lab. Columns
should be clearly labeled, with units.
- In this lab, measured quantities will probably be mass,
starting position of the spring, and stretched position of the
spring.
- Leave room for the results of calculations in your data table,
but be sure that it is clear which quantities were measured and
which quantities were calculated, as well as how they were
calculated.
- In this lab, calculated quantities will probably be the
stretching force, and the distance that the spring was
stretched.
- Data should be recorded as neatly as possible.
We all realize that there can be a lot going on in the laboratory,
so no one is expecting a "work of art" - just be sure that your
data table is readable.
- Be sure that you keep your original data. Never
recopy a data table to make it look neater.
- You will never collect too much data, but there
will definitely be times when you wish you had more.
- It is important that you work carefully and precisely,
but...
- ... it is more important that you have a good idea of
how precisely you are working.
- It is often a good idea to have one lab-group member making
preliminary calculations and plotting
preliminary graphs as you collect data. This can
tell you if things are going smoothly, and if not, you can make
adjustments to your equipment and or procedure.
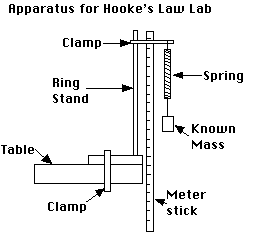 Equipment:
|
assorted small springs
|
rubber band
|
ring stand
|
set of known masses
|
|
ring-stand clamp
|
c-clamp
|
paper clip
|
ruler or meter stick
|
Safety Notes:
- Be sure to keep your feet out of the area in
which the masses will fall if the spring or rubber band breaks!
- Be sure to clamp the ring stand to the lab table, or weight it
with several books so that the mass does not pull it off the
table.
- You need to hang enough mass to the end of the spring to get a
measurable stretch, but too much force will
permanently damage
the spring. (An engineer would say that it has exceeded
its "elastic limit").
Setup:
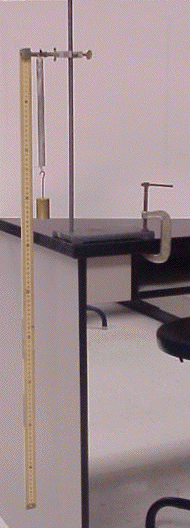
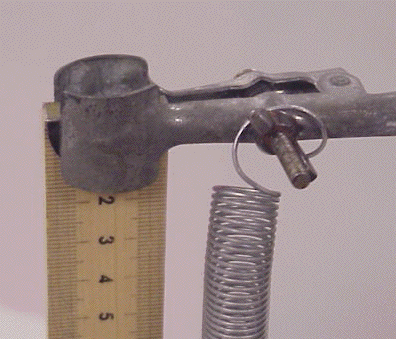
|
|
|
A method for attaching the meter stick and
spring.
|
|
|
The apparatus.
|
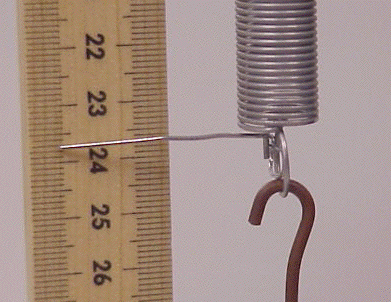
A pointer can be fashioned from a paper
clip.
|
- Assemble the apparatus as shown in the photos. Be sure to
clamp the ring stand to the lab table, or weight it with several
books. Otherwise, the photos are just suggestions - you might well
come up with a better way. If your apparatus differs significantly
from the suggested apparatus, you need to carefully describe it in
your lab report, in case someone wants to try to replicate your
results.
- Some springs tend to be "clenched" - their coils are pressing
against each other, and it takes a small force to simply get the
spring to the point that it will begin to stretch. If this is the
case, you may want to hang a small mass (20 g - 50 g) from the
spring initially and consider that to be the spring's starting
position.
- Spend a little mental effort considering how you are going to
measure the stretch of the spring precisely. Making a small
pointer out of a bent paper clip and attaching it to the end of
the spring has worked well for me in the past.
- The data that you will need to record are the rest position of
the spring (same for each trial), stretched position of the
spring, and the total mass hanging from the spring. Set up a data
table. A sample of part of a data table is shown below:
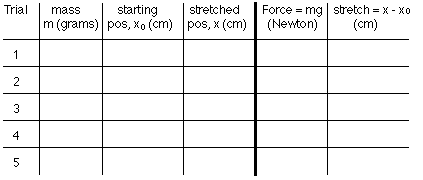
Note that:
- Each column is clearly identified.
- Since the quantities will be involved in calculations, a
variable is assigned to each.
- Units of each quantity are identified.
- Each trial is numbered. (No, 5 trials will
not be sufficient. This is a sample.)
- A column is provided for each calculated quantity.
- The method of calculation for each calculated quantity is
shown.
- Measured quantities are on one side of the data table,
clearly separated from quantities that are calculated from
them.
Procedure:
- For each trial, record the total mass, the starting position
of the spring (before hanging the mass) and the ending position of
the spring (while it is being stretched). (For most of our
springs, starting with 50 gm and proceeding in 50 gm increments
will be fine, but use some judgment and keep your eye on the
graph.)
- You need to be able to estimate
the uncertainty (precision) in measuring the rest and
stretched positions of the spring. Note that I said "estimate" -
not "guess" - you need to be able to justify your decision. How?
For our purposes, a little thought, a little discussion, and some
observations should do the trick. Also, we will consider the
measurement precision to be essentially the same for each trial.
Record your precision estimates in your data table.
- Repeat the process for at least one other (non-identical)
spring, and a rubber band. Use separate data tables for each.
Results:
- Calculate the stretching force (= mg. Note: Since mass is
measured in grams, you need to convert it to kilograms (=
103 grams) before multiplying by g (= 9.8
m/s2)) and the stretch of the spring (= x -
xo) for each trial.
- The stretch of the spring is calculated from two measurements,
so you can calculate
the uncertainty in the stretch. The manufacturer of the hooked
masses we use guarantee that they are within 2% of the "real
mass", and we will take their word for it.
- Construct a graph of force vs. stretch for each spring. Some
things to remember:
- All graphs have a title. What does this graph
represent? Be specific.
- Be sure to label each axis with the quantity it represents
and the units used.
- Pick the largest convenient scale for your
graph, and label each axis numerically.
- Draw the best smooth curve through the data
points. (The best smooth curve may be a straight line.)
- Add error bars to your points.
- If the best smooth curve is a straight line, you can easily
calculate the mathematical relationship between the graphed
quantities. An equation for a line is just y = mx + b, where m is
the slope (= rise/run) and b is the y-intercept.
Conclusions:
Go back and re-read your statement of purpose for this lab. Now,
answer the question. Here are some additional points you might want
to cover:
- Are your graphs of force versus stretch straight lines? (In
other words, is stretch proportional to force?) If so, what do the
values of "m" and "b" tell you about a spring?
- How confident can you be in your results? Why do you think
so?
- What measurement contributed the most uncertainty to your
results? What could be done to improve it?

![[Up]](../../../NavIcons/Up.GIF)
![[Home]](../../../NavIcons/Home.GIF)
![[Help]](../../../NavIcons/Help.GIF) [Lab
Index]
[Lab
Index]
BHS
-> Staff
-> Mr. Stanbrough
-> AP
Physics-> AP Labs-> this
page
last update August 19, 2009 by JL
Stanbrough


