Physics Lab
Motion of a Motorized Cart
![[Up]](../../../NavIcons/Up.GIF)
![[Home]](../../../NavIcons/Home.GIF)
![[Help]](../../../NavIcons/Help.GIF)
Purpose:
- To study the motion (position, displacement, velocity, and
acceleration) of a motorized cart.
- To practice constructing position vs. time and velocity vs.
time graphs for a motion.
Equipment:
|
constant velocity motorized cart
|
meter stick or metric tape
|
|
about 2 meters of ticker tape
|
graph paper
|
|
masking tape
|
stopwatch or watch with a seconds hand
|
|
data table
|
grading rubric
|
Description:
In this lab you will observe and measure the motion of a motorized
cart by marking its position along a strip of tape at regular time
intervals. Note that you can adjust the speed of the cart using the
small dial - find a speed that works well for you and then do not
change the cart's speed during the experiment.
Once you have a record of the cart's motion, you can measure and
record its position in a data table and construct a position vs. time
graph for the cart's motion. You can then calculate the displacement
and average velocity of the cart during each time interval, and
construct a velocity vs. time graph for the motion.
Although you will work as a team during this lab, each student
will turn in their own lab report.
Here is the rubric for this
lab.
Procedure:
Setup:
- Fasten a 2-meter strip of ticker tape to your lab table with
masking tape.
- Place the motorized cart beside the tape, near one end. Mark
the cart's starting position on the tape.
- Adjust the speed of the cart so that it takes at least 30
seconds for the cart to move the length of the tape.
Taking the Data:
- There are 3 jobs:
- one person's job is to release the cart at the
start of the run
- a second person marks the position of the cart on the
ticker tape
- the third person watches the clock and calls out regular (5
second intervals might be convenient) time intervals.
- You may want to make a couple of practice runs in order to get
everyone coordinated, and remember that the tape has another side
if you mess it up. When you are ready, release the cart and record
its positions.
Analysis:
- Use a meter stick or metric tape to measure each position of
the cart (measured from the start). Record your data in the
data table.
- Plot each position/time data pair on your position vs. time
graph.
- The position vs. time graph is already titled, and
the time axis has been labeled. You need to select a position
scale that creates the largest convenient graph that
accommodates your data, and label the position axis.
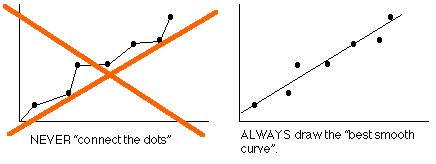
- Draw the straight line (use a straight edge) that best fits
your data points. DO NOT "connect the dots".

- Calculate and record the displacement (ending position -
starting position) of the cart during each time interval.
- Calculate and record the average velocity (displacement/time)
of the cart during each time interval.
- Plot each velocity/time data pair on your velocity vs. time
graph.
- The velocity vs. time graph is already titled, and
the time axis has been labeled. You need to select a velocity
scale that creates the largest convenient graph that
accommodates your data, and label the velocity axis.
- Draw the straight line (use a straight edge) that best fits
your data points. DO NOT "connect the dots".
- Calculate the slope of the position vs. time and velocity vs.
time graphs. Show your calculation.
Results and Conclusions:
- How do successive displacements of the cart compare? Why?
- What is the slope of the position vs. time graph? What is the
significance of this value?
- How would the position vs. time graph be different if the cart
had gone faster or slower?
- What is the slope of the velocity vs. time graph? What is the
significance of this value?
- Was the velocity of the cart more-or-less constant during its
motion? How do you know?
- How would the velocity vs. time graph be different if the cart
had gone faster or slower?
- What was the acceleration of the cart during its motion? How
do you know?
![[Up]](../../../NavIcons/Up.GIF)
![[Home]](../../../NavIcons/Home.GIF)
![[Help]](../../../NavIcons/Help.GIF)
last update November 22, 2005 by JL Stanbrough
