Physics Lab - Bouncing Ball "g"
![[Up]](../../../NavIcons/Up.GIF)
![[Home]](../../../NavIcons/Home.GIF)
![[Help]](../../../NavIcons/Help.GIF)
Printer-friendly versions of this file:
- Microsoft Word (*.doc)
- Adobe Acrobat Reader (*.pdf)
Purpose:
- To study kinematics graphs for an object in free fall.
- To measure the object's free fall acceleration, "g".
- To become familiar with the PascoTM motion sensor
and DataStudioTM software
Equipment:
|
Motion Detector and PascoTM 500 interface
|
c-clamp or stack of heavy books
|
|
DataStudioTM software
|
right-angle clamp
|
|
a large ball (basketball, volleyball, soccer ball)
|
|
Description:
We have claimed that the acceleration of an object in free fall is
about 9.8 m/s2 toward the surface of the Earth. Is it,
really? This is a fairly difficult question to answer, since falling
objects reach high speeds very quickly and determining their
velocities can be difficult. In this lab, you will use a motion
sensor to determine the position and velocity of an object in free
fall - a bouncing ball.
Procedure:
Setup:
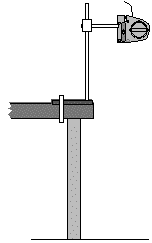
 Be
sure that the apparatus is set up as shown in the diagram, and
that the ring stand is either clamped to the lab table or weighted
so that it cannot easily be knocked off the table. Be sure that
the computer interface is on (green light on the front is
lit).
Be
sure that the apparatus is set up as shown in the diagram, and
that the ring stand is either clamped to the lab table or weighted
so that it cannot easily be knocked off the table. Be sure that
the computer interface is on (green light on the front is
lit).- Double-click on the file "bouncing_ball_g" that you will find
in your Group Shared folder. This will start the DataStudio
software and load the experiment file.

Taking Data:
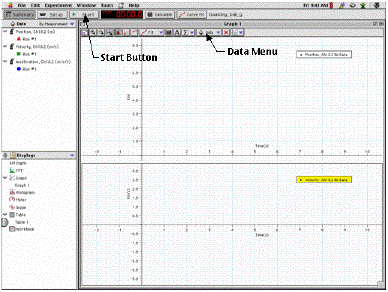
- Hold the ball about 15 cm beneath the motion sensor, then
click on the "Start" button and drop the ball. When the ball stops
bouncing, click the "Start" button again (it now says
"Stop").
- You may want to practice a couple of times. To remove the old
data from the graph, highlight either "Position, Ch1 & 2" or
"Velocity, Ch 1 & 2" and uncheck the data run in the Data
menu. You might also have to find a spot on the floor that is
relatively level in order to get a few bounces recorded.
Results:
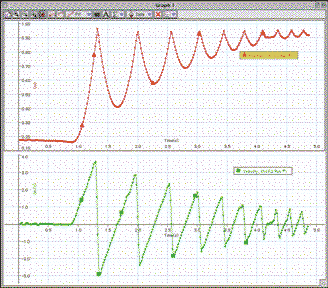
 To
get a good look at your results, use the mouse to drag a rectangle
around the part of the position vs. time graph that corresponds to
the bouncing of the ball. Notice that this highlights a portion of
the graph. Click on the "Scale to Fit" icon (
 )
to enlarge this part of the graph to fill the graph window. Notice
that the corresponding part of the velocity vs. time graph is
automatically enlarged also. Print a copy of your position vs.
time and velocity vs. time graphs. Sample results are shown at
right.
)
to enlarge this part of the graph to fill the graph window. Notice
that the corresponding part of the velocity vs. time graph is
automatically enlarged also. Print a copy of your position vs.
time and velocity vs. time graphs. Sample results are shown at
right.- Compare the position vs. time graph and the velocity vs. time
graph to determine when the ball was in the air.
- Click on the Smart Tool icon (
 )
and notice how easy it is to read time and velocity coordinates
from the velocity vs. time graph. Pick two points on each segment
of the graph that corresponds to "ball in the air" and record the
time and velocity in a data table. Use these values to calculate
the acceleration of the ball (acceleration = change in
velocity/time) while it was in the air for each bounce.
- Calculate the average value of these accelerations, and
compare it to g = 9.8 m/s2. (percent of
difference).
- Identify a portion of the velocity vs time graph that
corresponds to the time when the ball was in contact with the
floor. Record a pair of times and velocities and calculate the
acceleration of the ball while it was in contact with the floor.
- What you did in step 3 was a rather laborious way to calculate
the acceleration - and we do have a computer, after all!
Here is an interesting shortcut:
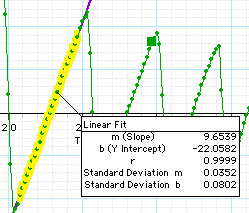
 Highlight
one of the straight portions of the velocity vs. time graph by
dragging the mouse. Now, from the Fit Menu, select "Linear".
The computer will calculate the equation of the line that best
fits the data points that you have highlighted, and then
display the equation.
Highlight
one of the straight portions of the velocity vs. time graph by
dragging the mouse. Now, from the Fit Menu, select "Linear".
The computer will calculate the equation of the line that best
fits the data points that you have highlighted, and then
display the equation.- Repeat this procedure to calculate the slope of each "ball
in the air" portion of the data, and record your results in a
data table.
- Calculate the average of the slopes, and compare this value
to g = 9.8 m/s2. (percent of difference)
Conclusions & Questions:
- On your graph of position vs. time, for one bounce,
indicate the portion of the graph that corresponds to
- the ball moving upward
- the ball at its highest point
- the ball moving downward
- the ball hitting the floor
- On your graph of velocity vs. time, for the same bounce as
step 1, indicate the portion of the graph that corresponds to:
- the ball moving upward
- the ball at its highest point
- the ball moving downward
- the ball hitting the floor
- How does the acceleration that you calculated using
acceleration = change in velocity/time compare to g = 9.8
m/s2? If there is a discrepancy between values, what do
you think caused it?
- How does the average slope that you calculated above compare
to g = 9.8 m/s2? Why is it that this slope is the free
fall acceleration of the ball?
- Why do you think that the acceleration of the ball while it
was in contact with the floor is such a large value?
![[Up]](../../../NavIcons/Up.GIF)
![[Home]](../../../NavIcons/Home.GIF)
![[Help]](../../../NavIcons/Help.GIF)
last update November 4, 2001 by JL
Stanbrough
 Be
sure that the apparatus is set up as shown in the diagram, and
that the ring stand is either clamped to the lab table or weighted
so that it cannot easily be knocked off the table. Be sure that
the computer interface is on (green light on the front is
lit).
 To
get a good look at your results, use the mouse to drag a rectangle
around the part of the position vs. time graph that corresponds to
the bouncing of the ball. Notice that this highlights a portion of
the graph. Click on the "Scale to Fit" icon (
 Highlight
one of the straight portions of the velocity vs. time graph by
dragging the mouse. Now, from the Fit Menu, select "Linear".
The computer will calculate the equation of the line that best
fits the data points that you have highlighted, and then
display the equation.