A Kinematics Spreadsheet


Introduction:
The traditional way to solve numerical kinematics problems is to
learn a set of kinematics formulas and then learn how to put the
right values in the right places in these formulas. This seems very
complicated and confusing for beginning physicists.
As you have seen, a tabular approach will solve just about every
kinematics problem that you will encounter in Physics, and it is a
lot less complicated. A spreadsheet is a convenient way to automate a
tabular solution, and allows you to (a) solve routine problems
easily, (b) solve some pretty complicated problems without a lot of
bother, and (c), most importantly, experiment with various
combinations of accelerations and velocities to see what happens.
Here are detailed, step-by-step instructions for constructing a
(ClarisWorks) spreadsheet that will solve many numerical kinematics
problems that you will encounter in this course.
Procedure:
|
Here are the values and formulas you need to
enter in the kinematics spreadsheet.
|

|
Open a new ClarisWorks spreadsheet.- In cell A1, type the spreadsheet title "Kinematics Spreadsheet
by __you__".
- In cell A3, type the label for the acceleration "acc (m/s/s)
="
- In cell A4, type the label for the time interval "time int (s)
= ".
- In cell B3, type the current value of the acceleration,
"10".
- In cell B4, type the current value of the time interval,
"1".
- In cell A6, type the heading for the time column, "time
(s)".
- In cell A7, type the value of the starting time, "0".
- You could type "1" in cell A8, etc. - but don't. We want to
increment the time by the time interval, which might not always be
1. It will be handier to use a formula in cell A8, which is "=A7
+$B$4". This says add the value in cell A7 (the last time), to the
value in cell B7 (the time interval). The dollar signs ("$") tell
the spreadsheet not to change the time interval cell when this
formula is copied. The value that should appear in cell A8 after
you have typed the formula is "1".
- Click and drag the mouse to select cells A8 through A32 (or
so). Then, in the Calculate menu, select "Fill Down". Boom!
- Change the value in cell B4, to "0.1" say, and notice that all
of the time values change to count time by tenths of a second.
Cool, not? Now, change B4 back to "1".
- In cell B6, type the column heading for the instantaneous
velocity, "vel (m/s)"
- In cell B7, type the value of the starting velocity, "0"
- The change in velocity for each time interval equals the
object's acceleration times the time elapsed. The formula for cell
B8 is "=B7+$B$4*$B$3".
- Click and drag the mouse to select cells B8 through B32 (or
so). Then, in the Calculate menu, select "Fill Down".
- Change the value of the acceleration in cell B3, and note that
all of the velocities change automatically.
- In cell C6, type the column heading for the average velocity,
"ave v (m/s)".
- Cell C7 is blank, since there isn't an average velocity until
the end of the first time interval.
- Cell C8 contains the average of the velocities in cells B7 and
B8. The formula is "=($B$7+B8)/2".
- Again, highlight the rest of the average velocity column and
"Fill Down".
- In cell D6, type the column heading for the distance moved
column, "dist (m).
- In cell D7, type the value of the starting position, "0".
- The distance traveled equals the average velocity times the
elapsed time. The formula for cell D8 is
"=$D$7+C8*(A8-$A$7)".
- Use "Fill Down" to fill in the rest of the distance
column.
|
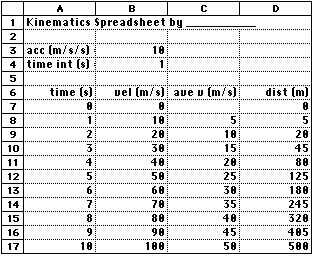
This is what the "finished product should look
like.
|

|
Extensions:
You can easily construct rudimentary velocity vs. time or position
vs. time graphs by highlighting the appropriate values and choosing
 (line
graph) from the dialog that appears when you choose "Make Chart" from
the Options menu.
|
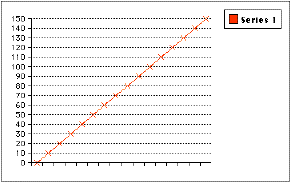
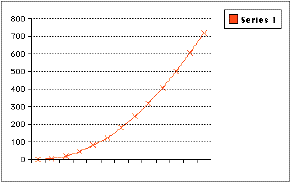
Sample velocity vs. time (middle) and position vs. time
graphs (right) for the sample spreadsheet.
|

|

|
Using the Spreadsheet:
To solve a typical kinematics problem (with constant
acceleration), you might need to change the starting velocity (cell
B7) or the acceleration (cell B3) and look through the table for a
value. You might also need to change the time interval (cell B4) to
increase accuracy, or perhaps use "Fill Down" to increase the size of
the table. Here are some examples.


last update September 14, 2000 by JL
Stanbrough


![]() (line
graph) from the dialog that appears when you choose "Make Chart" from
the Options menu.
(line
graph) from the dialog that appears when you choose "Make Chart" from
the Options menu.
